

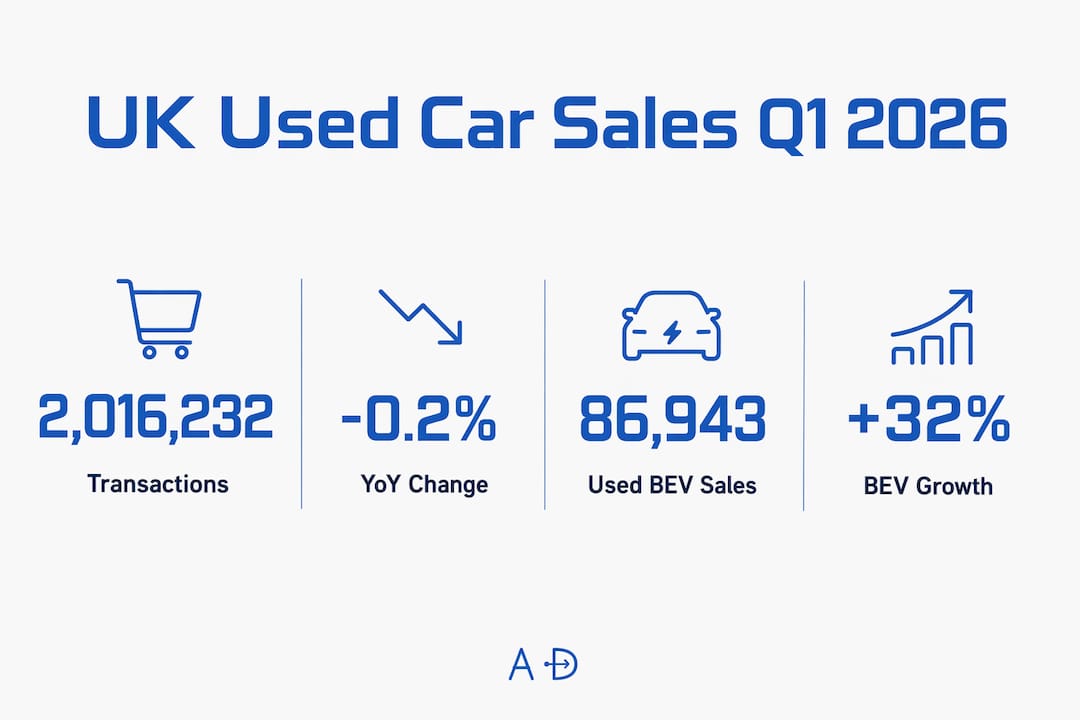
The UK used-car market is broadly stable in Q1 2026, with 2,016,000 transactions recorded — a marginal -0.2% year-on-year decline that signals a market holding its ground rather than retreating. The headline number masks a more interesting story underneath: used battery-electric vehicle (BEV) sales surged 32.0% to 86,943 units in the same quarter, while prices for older petrol and diesel cars are softening and the average fleet age has reached a new high. For buyers, that combination points to genuine value in certain segments. For sellers, it demands sharper pricing discipline than at any point in the past three years.
Three facts define where the second-hand car market in the UK stands right now:
- Transactions are flat, not falling. Q1 2026's units compares closely with Q1 2025, a difference of fewer than 5,000 cars across the whole quarter.
- Used EVs are the growth engine. BEVs now account for roughly 4.3% of all used transactions, up from a negligible share just two years ago.
- Prices are diverging by segment. The Autotrader retail price index put the average used-car price at £17,194 in June 2026, but that average conceals significant movement in both directions depending on fuel type and age.
The single number to remember: 86,943 used BEVs sold in Q1 2026 alone, a 32% jump year-on-year.
Table of Contents
- What do the latest UK used car market trends show?
- How are used car prices moving by segment?
- What's really happening in the used EV market?
- What's driving supply and demand right now?
- What should buyers and sellers do right now?
- What does the rest of 2026 look like for used car prices?
- Where do these numbers come from?
- Key Takeaways
- The market is more nuanced than the headlines suggest
- See exactly what any used car is worth before you buy
- FAQ
- Useful sources
What do the latest UK used car market trends show?
Transaction volumes and year-on-year comparison

SMMT's quarterly data shows Q1 2026 at 2,016,000 units, essentially flat against Q1 2025's 2,020,990. Full-year 2025 delivered about 7.8 million transactions, a modest increase over 2024 and the third consecutive year of growth. The baseline Cox Automotive forecast for 2026 projects roughly 7.83 million transactions for the full year, a 0.3% gain, with an upside scenario of approximately 8.03 million if credit conditions improve.
| Metric | Value | Period |
|---|---|---|
| Q1 2026 transactions | 2,016,232 | Q1 2026 |
| YoY change (Q1) | -0.2% | vs. Q1 2025 |
| Full-year 2025 transactions | 7.8 million | FY 2025 |
| Full-year 2025 YoY change | — | vs. FY 2024 |
| Baseline 2026 forecast | ~7.83 million | FY 2026 |
Price indicators
The Autotrader retail price index recorded an average used-car price in June 2026. AA Cars' used-EV index put the average price of the 20 most searched-for EVs at £13,940 in Q2 2026, down from £15,488 a year earlier. Petrol and diesel models in the top 20 saw average prices fall roughly 5.3% year-on-year, while the hybrid index edged slightly higher.
Fuel type breakdown (Q1 2026)
| Fuel type | Q1 2026 units | Market share |
|---|---|---|
| Petrol accounted for the majority share of the market | ||
| Diesel comprised a significant share of the market | ||
| Hybrid (HEV) transactions formed a noticeable part of the market | ||
| Electric (BEV) sales grew notably, making up a small but growing market share | ||
| Plug-in hybrid (PHEV) formed a smaller segment of transactions |

Top models and regions
The Popular models included the Ford Fiesta, Vauxhall Corsa, and Volkswagen Golf. The South East, North West, and West Midlands were among the leading regions by used-car transaction volumes.
- Top models: Ford Fiesta, Vauxhall Corsa, VW Golf, Ford Focus, Nissan Qashqai
- Top regions: South East, North West, West Midlands, East, South West
Pro Tip: If you're sourcing stock or hunting for a deal, the South East and North West consistently generate the highest transaction volumes, which means more listings, more price competition, and faster price discovery.
How are used car prices moving by segment?
Overall direction
The market-level average of £17,194 (Autotrader, June 2026) is holding up, but the composition of that average has shifted. Older cars are pulling the index higher while nearly-new stock faces downward pressure from improving new-car supply. The used car prices UK picture is genuinely two-speed right now.
By fuel type
- Petrol and diesel: Still 88% of transactions combined, but average prices for the top 20 petrol/diesel models fell approximately 5.3% year-on-year. Diesel volumes fell 3.3% in full-year 2025 and the structural contraction is continuing.
- Hybrids (HEV): The most price-resilient segment. The hybrid index edged up slightly, reflecting strong buyer demand and limited supply of well-maintained examples.
- EVs: Headline average down roughly 10% year-on-year (£15,488 to £13,940 for the top 20 most searched models), but the three-to-five-year cohort is stabilizing and showing pockets of growth.
Age cohort patterns
The 10–15-year and over-15-year cohorts are showing the most price strength. Supply is genuinely tight there because the pandemic-era production dip reduced the number of cars entering those age brackets. The nearly-new (0–2 year) segment faces the most pressure as new-car supply recovers and lease returns increase.
Superminis remain the dominant category at 32.1% of transactions, lower-medium cars follow at 26.9%, and dual-purpose vehicles (SUV-style) are the fastest-growing segment at 16.8%.
Pro Tip: Sellers pricing older stock should pull live retail-market data, not cost-plus calculations. The 10–15-year cohort currently offers the strongest margin potential precisely because most dealers are not watching it closely enough.
What's really happening in the used EV market?
Used BEV transactions hit 86,943 in Q1 2026 alone, a 32.0% year-on-year increase. For context, full-year 2025 delivered 274,815 used BEV transactions, up 45.7% on 2024. The growth trajectory is steep and accelerating.
EV price movement at a glance
| Metric | Value | Source / Period |
|---|---|---|
| Top 20 EV average price (Q2 2026) | £13,940 | AA Cars, Q2 2026 |
| Top 20 EV average price (Q2 2025) | £15,488 | AA Cars, Q2 2025 |
| YoY price change | approx. -10% | AA Cars |
| Q1 2026 BEV transactions | 86,943 | SMMT |
| Q1 2026 BEV YoY growth | +32.0% | SMMT |
The headline price fall of roughly 10% year-on-year is real, but it is not uniform. The three-to-five-year EV cohort is stabilizing and showing short-term growth, driven by improving buyer confidence and the fact that these cars are now genuinely affordable for a mainstream buyer. Older EVs (over seven years) carry more battery uncertainty and are moving more slowly.
The standout figure: used BEV transactions grew 32% in Q1 2026, making EVs the fastest-growing segment in the entire used market.
What to check before buying a used EV
EV valuation requires a different checklist than a petrol car. When buying a used car with an electric powertrain, prioritize:
- Battery state-of-health (SoH): Request a diagnostic report. Anything below 80% SoH will meaningfully reduce real-world range.
- Software and OTA update history: Confirmed updates often improve efficiency and fix known issues. A car that has never been connected to the manufacturer's network is a flag.
- Warranty and connected-service transferability: Some manufacturer battery warranties transfer to second owners; others do not. Confirm before you commit.
- Charge speed verification: DC fast-charging capability varies significantly even within the same model year. Check the onboard charger spec, not just the headline range figure.
Pro Tip: For used EVs specifically, a battery health certificate from a specialist (many franchised dealers now offer these for £50–£100) is worth every penny. It is the single most important document in any used EV transaction.
What's driving supply and demand right now?
Where stock is thin
The substantial shortfall of three-to-five-year-old cars versus 2019 levels is the defining supply story of 2026. That gap was created by the pandemic-era production collapse and has not yet been filled by recovering new-car output. Cars registered in 2021 and 2022, when new-car volumes were depressed, are simply not entering the used market in the numbers the trade needs.
The average fleet age of 9.7 years (up from 8.0 in 2019) tells the same story from a different angle. A fleet that old means fewer young used cars in circulation, which keeps prices for three-to-five-year stock elevated relative to what buyers might expect.
Distribution dynamics
Independent retailers grew their share of one-to-five-year cars in 2025, while franchised retailer share fell from 70% to 68%. That shift matters for buyers: independents are increasingly competitive on younger stock and often price more aggressively than franchised networks.
Regional supply and demand
The South East accounts for more than 14% of all Q1 2026 used-car transactions — nearly double London's volume. For dealers, that concentration means the South East sets the price tone for a significant share of the national market.
The supply constraint in plain terms: the 1.8-million-car shortfall in the three-to-five-year bracket is not resolving quickly. New-car production would need to run well above historical norms for two to three years to close that gap.
Pro Tip: Dealers tracking days-to-sell by age cohort will find the three-to-five-year EV bracket turning faster than almost any other segment right now. If you are sourcing at auction, that cohort is worth a premium bid.
What should buyers and sellers do right now?
For buyers: a practical checklist
The market rewards preparation. Before you commit to any purchase:
- Run a full vehicle history check — outstanding finance, write-off markers, and mileage discrepancies are the three most common issues.
- Pull comparable live listings for the same model, age, mileage, and spec. The Autotrader average of £17,194 is a market-level figure; your specific car may sit well above or below it.
- For EVs, request a battery health report and confirm warranty transferability before negotiating price.
- Check the service history against the manufacturer's schedule. A gap of more than 12 months in a petrol car, or a missed software update in an EV, is a negotiating point.
- Get pre-approved financing before you visit a dealer. Knowing your ceiling gives you leverage and prevents dealer finance from inflating the effective purchase price.
For sellers and dealers: the playbook
- Source from the right cohorts. The 10–15-year bracket offers the strongest margin potential right now because supply is tight and most buyers are not comparison-shopping as aggressively as they do for newer stock.
- Price from live retail data, not cost-plus. A car priced 5% above the live market average will sit. A car priced at or just below it will sell within days.
- Manage stock age actively. Over-aged stock ties up capital and depreciates faster as overheads rise. Set a hard 60-day rule and reprice at day 30.
- Market to targeted audiences. A three-to-five-year EV listed with its battery SoH certificate and charge speed specs will attract a more qualified buyer and close faster than a generic listing.
Pricing from live market data rather than cost-plus is the single biggest operational change a dealer can make in the current environment. The margin is in the sourcing and the speed of turn, not in holding out for a higher retail price.
Pro Tip: For negotiating used car price, a buyer's strongest opening is a printed comparable-listing comparison showing three similar cars priced lower. A seller's strongest counter is a battery health certificate or a full-service history that the comparables lack.
Financing availability is influencing buyer behavior in a meaningful way. Higher interest rates over the past two years pushed some buyers toward older, cheaper stock they could purchase outright. As rates ease, expect demand for three-to-five-year cars to strengthen further, particularly for EVs where monthly finance payments are becoming competitive with petrol running costs.
A concrete example of what works: A dealer sourcing a five-year-old EV at auction, pricing it at the live market average with a battery health certificate attached, and listing it with charge-speed specs and a 30-day return policy is consistently selling within two weeks. The same car without that documentation sits for six weeks or longer.
What does the rest of 2026 look like for used car prices?
Three scenarios are in play for the full year, based on the Cox Automotive Q4 2025 forecast:
- Baseline (most likely): Approximately 7.83 million transactions, a 0.3% gain on 2025. Prices hold broadly flat, with modest softening in petrol/diesel and continued stabilization in used EVs. This assumes no major macro shock and a gradual easing of supply constraints.
- Upside: Approximately 8.03 million transactions (+2.9%) if credit conditions improve, consumer confidence firms, and new-car supply continues recovering. Used EV prices could stabilize or tick up as demand outpaces supply in the three-to-five-year cohort.
- Downside: Approximately 7.36 million transactions (-5.7%) if affordability pressures intensify, interest rates stay elevated, or the ZEV mandate creates compliance-cost disruptions that reduce new-car supply and, in turn, future used supply.
Key triggers to watch monthly
- EV share of used transactions: If BEV share climbs past 5% of monthly transactions, it signals accelerating mainstream adoption and will pull used EV prices higher.
- Time-to-sell for three-to-five-year stock: Any lengthening here signals demand softening before it shows up in price indexes.
- New-car registration volumes: Strong new-car months in 2024–2025 will feed the used market in 2027–2028. Watch SMMT monthly new-car data as a leading indicator.
- Interest rate movements: A Bank of England rate cut would directly improve affordability for financed purchases, likely lifting transaction volumes within one to two quarters.
Pro Tip: Set a monthly calendar reminder to check SMMT's used-car transaction release and the AA Cars price index. Both publish within the first two weeks of the following month. Two data points, 15 minutes, and you will know whether the market is tracking the baseline or drifting toward one of the tail scenarios.
The baseline forecast in one line: 7.83 million transactions for 2026, essentially flat on 2025, with used EVs as the only segment showing consistent volume growth.
Where do these numbers come from?
Primary data sources
| Source | What it covers | Period |
|---|---|---|
| SMMT | Official UK used-car transaction volumes by fuel type, model, region, and color | Q1 2026 / FY 2025 |
| AA Cars used-EV index | Average prices for the 20 most searched-for used EVs | Q2 2026 |
| Autotrader retail price index | Average used-car retail price across millions of listings | June 2026 |
| Statista | Statistical compilations of UK used-car industry data | Various periods |
| Cox Automotive | Full-year 2026 scenario forecasts | Q4 2025 forecast |
How price indexes differ from simple averages
A simple average of all listed prices would be distorted by the mix of stock on the market at any given time. The Autotrader retail price index controls for model mix, age, and mileage to produce a like-for-like comparison. The AA Cars EV index tracks a fixed basket of the 20 most searched-for models, making it a consistent measure of affordability for mainstream EV buyers. CarGurus publishes a used car price trends index built from millions of live listings, which captures real-time price movement rather than retrospective transaction data.
Caveats
- SMMT periodically revises historic data derived from DVLA records, so quarterly figures can shift slightly after initial publication.
- Regional data reflects registration addresses, not necessarily where cars are sold, which can understate London's true market activity.
- Addapted's valuation signals draw on live listing data across multiple platforms to generate real-time price comparisons. Where Addapted data is referenced in examples in this article, it reflects that live-listing methodology rather than SMMT transaction records.
Pro Tip: When comparing price indexes, always check whether the source is using listing prices (what sellers ask) or transaction prices (what buyers actually paid). The gap between the two can be 3–8% in a soft market.
The used car price average figure of £17,194 (Autotrader, June 2026) is a retail listing average, not a transaction average. Actual sale prices are typically lower.
Key Takeaways
The UK used-car market is stable in volume but diverging sharply in price by segment, with used BEVs growing 32% in Q1 2026 while petrol and diesel average prices fell roughly 5.3% year-on-year.
| Point | Details |
|---|---|
| Market volume is flat | Q1 2026 delivered 2,016,232 transactions, down just 0.2% year-on-year. |
| EVs are the growth story | BEV transactions rose 32.0% in Q1 2026 to 86,943 units, reaching ~4.3% market share. |
| Prices diverge by segment | Average used EV prices fell ~10% YoY to £13,940; petrol/diesel top-20 models fell ~5.3%. |
| Supply is structurally tight | A shortfall of ~1.8 million three-to-five-year-old cars versus 2019 levels keeps prices elevated in that cohort. |
| Addapted for price discovery | Addapted's live-market valuation tools let buyers instantly compare listings and spot fair prices before committing. |
The market is more nuanced than the headlines suggest
Most coverage of UK used-car trends in 2026 leads with the flat transaction number and calls it a day. That misses the point. A market where total volume is essentially unchanged but the composition is shifting this fast — EVs up 32%, diesel down structurally, the average fleet age at a record 9.7 years — is not a stable market. It is a market in transition that happens to be holding its aggregate volume.
The practical implication for buyers is that the averages are almost useless as a guide to any specific purchase. A three-to-five-year EV in good condition with a battery health certificate is behaving like a scarce asset right now. A five-year-old diesel hatchback is not. Treating them as interchangeable because they both fall under "used car" is how buyers overpay and sellers underprice.
For dealers, the message from the data is equally clear: margin lives in sourcing discipline and stock-turn speed, not in holding out for a higher retail price. The independents who grew share in younger stock in 2025 did so by moving faster and pricing tighter than franchised networks. That playbook is available to anyone willing to use live market data rather than gut feel.
The one thing I would flag for the next quarterly update: watch the time-to-sell metric for three-to-five-year EVs. If that cohort starts sitting longer, it will be the first signal that the EV demand surge is plateauing. Until then, the data supports treating it as the strongest segment in the market.
See exactly what any used car is worth before you buy
Knowing the market trends is one thing. Knowing whether the specific car in front of you is priced fairly is another. Addapted gives you both in seconds.

The platform pulls live pricing data across thousands of UK listings and shows you the lowest, highest, and average price for any model, mileage, and spec combination. Run a car valuation before you negotiate and you will know immediately whether the asking price is reasonable or inflated. Addapted also tracks price history and sends instant alerts when a car you are watching drops in price, so you never miss a deal because you were not checking daily. For used EV buyers, the tool surfaces comparable listings with battery health data where available, cutting through the noise in the fastest-moving segment of the market. Start a free valuation check today and go into your next negotiation with the numbers on your side.
FAQ
Are used car prices dropping in the UK?
It depends on the segment. Petrol and diesel models in the top 20 fell roughly 5.3% year-on-year, and the average price of the 20 most searched-for used EVs dropped from £15,488 to £13,940 (approximately 10%) over the same period. The overall Autotrader retail price index held at £17,194 in June 2026, suggesting the market average is broadly flat while individual segments diverge.
Will second-hand car prices drop in 2026?
The baseline forecast projects roughly 7.83 million transactions for 2026, essentially flat on 2025, which implies price stability rather than a broad decline. A downside scenario of approximately 7.36 million transactions is possible if affordability pressures intensify, which would push prices lower. The three-to-five-year EV cohort is the one segment where prices may firm rather than fall.
What second-hand cars are in high demand in the UK?
The Popular models included the Ford Fiesta, Vauxhall Corsa, and Volkswagen Golf. Among segments, superminis account for 32.1% of all used sales, and dual-purpose SUV-style vehicles are the fastest-growing category. Three-to-five-year used EVs are the fastest-turning cohort in terms of days-to-sell.
What is the 12-car rule in the UK?
The 12-car rule is an informal industry guideline suggesting that selling more than 12 cars per year as a private individual may indicate trading activity, which would require registration as a motor trader for tax and consumer-protection purposes. HMRC applies a facts-and-circumstances test rather than a hard numerical threshold, so anyone regularly buying and selling cars for profit should seek advice from a qualified accountant or HMRC directly.
How does fleet age affect used car supply?
The UK vehicle parc average age reached a record 9.7 years in 2026, up from 8.0 years in 2019. A higher average age means fewer young used cars entering the market, which tightens supply for the three-to-five-year cohort and keeps prices in that bracket elevated. It also means the used market is increasingly dependent on healthy new-car sales today to replenish supply two to four years from now.
Useful sources
The table below lists the primary sources behind this article's data, what each covers, and how often they update.
| Source | What it contains | Update frequency |
|---|---|---|
| SMMT used-car sales data | Official quarterly UK used-car transaction volumes by fuel, model, region | Quarterly |
| AA Cars used-EV price index | Average prices for the 20 most searched-for used EVs | Quarterly |
| Autotrader retail price index | Average used-car retail price across millions of listings | Monthly |
| CarGurus price trends | Live listing-based price index across millions of UK listings | Continuous |
| Statista UK used-car industry | Statistical compilations, long-run series, and market-size data | Varies |
| Addapted valuation platform | Live multi-listing price comparison, valuation, and price-drop alerts | Real-time |
How to use these sources together: SMMT gives you the official transaction count. Autotrader and AA Cars give you the retail price signal. CarGurus gives you the live market pulse. Statista gives you the long-run context. Addapted ties it together for any specific car you are evaluating.
SMMT periodically revises historic transaction data as DVLA records are updated. Always use the most recently published quarterly release rather than figures from secondary summaries, which may reflect an earlier revision.
Pro Tip: Bookmark the SMMT used-car sales page and check it within 48 hours of each quarterly release. The first published figure is the one most media outlets cite, but a revised figure sometimes appears two to four weeks later and can shift the YoY percentage by a fraction of a point.